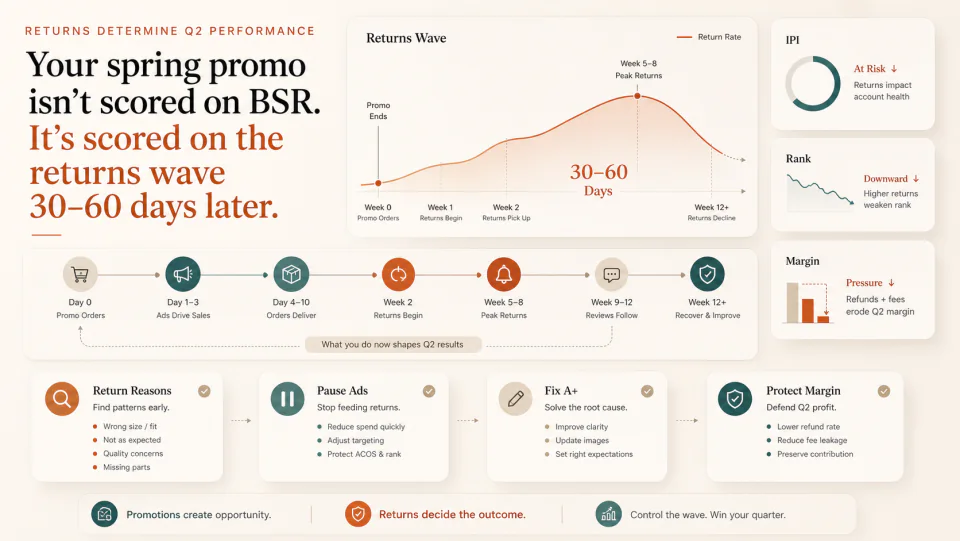
Your spring promo isn't scored on BSR. It's scored on the returns wave 30-60 days later.
Spring-promo sales and BSR look good right now. Then IPI starts slipping, negative reviews cluster, and Rufus quietly deranks the high-return ASINs. Here's the 60-day return-management playbook that actually decides Q2 margin.
By WAYAMZ Team
Orders came in. BSR moved up. Ad reports look clean. Week three after spring promo, most sellers are in the victory-lap phase.
After ten years running accounts on Amazon US, here’s the honest read: whether a spring promo was actually profitable doesn’t settle until late June. What eats the margin is the returns wave that peaks in the 30–60 day window after the promo closes — and by the time it shows up on a month-end report, the window to act on it is already closed.
Most sellers are watching the wrong report
Week 1 after promo: everyone is in PPC dashboards, running ACoS post-mortems. Week 2: IPI starts slipping on the high-volume SKUs. Weeks 3–4: new 1-star reviews cluster in the same ASINs. Weeks 5–6: Rufus and the organic ranker begin to suppress impressions on high-return ASINs — quietly, without a notification.
By the time the month-end return-rate number is visible, the damage is six weeks deep. Return rate is not a month-end metric. It’s a week-2 metric.
Why returns cluster in weeks 2–8
Amazon’s standard buyer return window is 30 days on most categories, 90 days on a subset. Volume bought in the promo cascades through a predictable curve:
- Week 1 — returns still negligible, everyone feels fine
- Weeks 2–4 — return rate begins to climb
- Weeks 5–8 — peak returns, negative reviews cluster, IPI takes its first real hit
- Weeks 9–12 — long-tail returns continue to weigh on the listing
You are never “avoiding” this curve — you’re either managing it now or absorbing it later. The choice is purely about whether you see it before Amazon does.
Not all returns are the same problem
Before you treat returns as a single number, split the Customer Returns Report by reason — four distinct failure modes, four different fixes:
- Wrong-item / damage-in-transit. Operations-controllable. File FBA reimbursement; the claim window is 60 days and it’s not recoverable after that.
- Buyer remorse / size mismatch. This is a detail-page failure. A+ imagery, size chart, and variation copy need to change in the same week.
- Quality defect. Supply-chain root cause. If you don’t fix it upstream it will keep bleeding review score and BSR indefinitely.
- Fraudulent return. Amazon has tightened policy here over the last two years. The window to dispute is narrow but it exists — document and appeal within SLA.
Treating these as one KPI (“return rate up, run discount”) is how teams lose a full quarter.
The first 48 hours after you start seeing the wave
Three moves to run today — not at month-end:
- Pull the Customer Returns Report for the last 30 days, aggregate by
ASIN × reason. The top three SKUs typically account for around 60% of return volume. That’s where the entire intervention lives. - Isolate the high-return SKUs and pause their ads. Continuing to drive paid traffic into a listing that’s actively returning is adding fuel. Stop the bleed before you optimize anything.
- Edit A+ content and the main image to answer the most frequent return reason inside the listing itself — not in a follow-up email. The next cohort of buyers shouldn’t fall into the same trap the last cohort already proved exists.
How to decide: save the SKU, or clear it?
After the A+ / size chart / main-image revisions have been live for 2–3 weeks, pull the return-rate delta:
- Return rate down ≥ 30%. Keep saving it. Now layer in review velocity (Vine, follow-up email) and hold price steady.
- Return rate down 10–30%. One more round of supply-chain changes — incoming material spec, packaging, or unit QA. Give it another 2–3 weeks.
- Return rate down < 10%. Accept the verdict. Pause ads, run a clearance Coupon to drain inventory, and redirect the budget and the SKU slot to a new launch.
The cost of infinitely life-supporting an unprofitable SKU in Q2 is roughly the cost of two new-product launches. That’s the trade-off.
The AI-assisted signal layer
Return-reason distribution, review-content shifts, and new-keyword spikes in negative reviews are too noisy for a human to watch daily. Three jobs that a simple agent should own:
- Daily aggregation of the Returns Report plus new reviews, producing per-ASIN Top-3 return reasons.
- Anomaly detection on negative-review language — flag when terms like “doesn’t fit,” “broke after a week,” or “smaller than described” start showing up at unusual frequency.
- Listing-vs-reality diff. Cross-reference return reasons with the keywords in your own title / bullet / A+ copy. Where the gap is biggest, you are — in effect — paying to mislead the buyer. Fix the copy first; then fix the conversion.
You don’t need a sophisticated ML stack for any of this. A scheduled script, the Amazon reports, and an LLM summarization step are enough.
Q2 runway: three milestones before Prime Day
If you run only one calendar as an Amazon operator between now and June, this is it:
- End of April — spring-promo return triage complete. Every high-return SKU has a decision on file: save / re-fix / clear.
- Mid-May — detail pages hardened for Prime Day. A+, size chart, review gaps, and backend keywords all closed.
- Early June — ad budget re-allocated around healthy SKUs and confirmed Prime Day hero products. IPI restored to 500+ so restock limits don’t bite during the window that matters.
Miss April, you negotiate the rest of Q2 with less margin than you planned for. Miss May, your Prime Day listing isn’t at full strength. Miss June, the window to pre-position for the biggest event of the year is already closed.
Last line
Sales are the front of house. Returns are the back of house — the truer scoreboard, and the slower one. What the front of house celebrated in March, the back of house reports in late June.
The sellers who quietly out-earn their cohort in Q2 are not the ones who ran the boldest spring promo. They’re the ones who watched the return-reason mix in weeks 2–4 and made three uncomfortable calls before the mid-April momentum faded.
If you only take one thing from this: stop reading the month-end return-rate number. Read the weekly delta by ASIN × reason, and act on the top three. Everything else in the Q2 playbook is downstream of that discipline.